In 1990, psychologist Mihály Csíkszentmihályi published Flow: The Psychology of Optimal Experience. His finding was precise: individuals reach a state of peak performance — deep focus, low friction, high output quality — when the difficulty of a task is well-matched to their capability.
When challenge exceeds capability: anxiety, overload. When capability exceeds challenge: boredom, disengagement. When they match: flow.
He was describing individuals. I’ve been thinking about what happens when you apply this lens to a software team.
A useful metaphor, not a direct derivation
Let me be honest about something upfront: applying Flow Theory to a team-as-system is a conceptual analogy, not an empirical derivation. Csíkszentmihályi’s research describes individual psychological states. Teams don’t experience anxiety or boredom in the same phenomenological sense.
But the directional insight transfers. And when you combine it with some well-established mathematics from queueing theory, something interesting emerges.
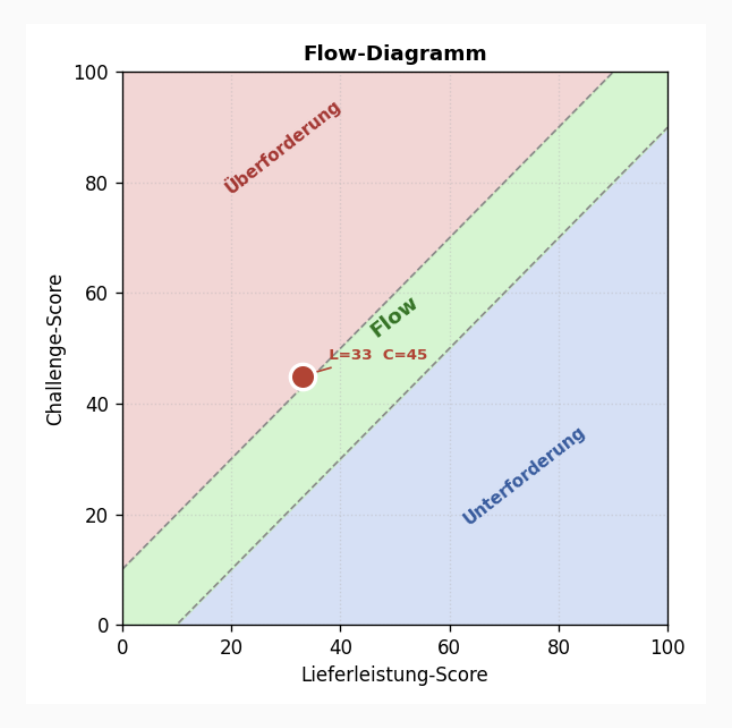
If you look at flow, there are two dimension to take into account:
- Challenge = the aggregate demand on the system: work in progress, queue depth, variability, arrival pressure
- Delivery Capability = the system’s capacity to handle that demand: throughput, predictability, cycle time consistency
When these two forces are approximately balanced, teams tend to operate at their best. When they aren’t, you see recognisable patterns:
| Too much challenge | Balanced | Too little challenge |
|---|---|---|
| 🔥 Overload — more arriving than leaving, work piling up, blockers accumulating | ⭐ Flow — stretched but delivering; healthy, sustainable pace | 🌱 Under-utilised — smooth delivery, but goals not ambitious enough |
Using this, you can create a score, that potentially positions teams on a map that describes where they are in regards to flow:
Little’s Law
The most powerful theoretical grounding for this model comes from Little’s Law (1961), a mathematically proven result from queueing theory:
L = λ × WWhere L = Work in Progress, λ = arrival rate, W = cycle time.
Rearranged: W = L / λ
The implication is stark: if throughput stays constant, reducing WIP by half cuts cycle time by half. Conversely, a team that takes on more work without increasing throughput will see cycle times grow proportionally.
This isn’t a process preference. It’s a mathematical inevitability.
Little’s Law is why “stop starting, start finishing” isn’t just a Kanban slogan — it’s an empirically grounded lever. High WIP is not just uncomfortable. It is structurally guaranteed to produce longer delivery times. These patterns can be used to define, what challenge or delivery look like mathematically.
Why variability matters as much as volume — Kingman’s formula
Volume isn’t the only driver of challenge. Variability is equally important.
Kingman’s formula from queueing theory shows that waiting time in a system grows multiplicatively with variability — both in how often work arrives and in how long it takes to complete. The key insight: even at moderate load levels, high variability in cycle times causes disproportionately long queues and makes planning unreliable.
This is why a team can have seemingly manageable WIP but still feel chaotic: if some items take 2 days and others take 40, the system is hard to predict and hard to reason about. Unpredictability is itself a form of challenge.
Kingman’s formula is proven for single-server queues. A software team is a multi-server system. The directional insight transfers — variability increases waiting time in any queueing system — but treat it as a well-grounded analogy rather than a precise quantitative model.
Why percentiles, not averages
One more piece of the theory worth naming: why do Cycle Time discussions so often mislead?
Because cycle times in software delivery follow right-skewed distributions. Most items finish quickly. A long tail of slow items — blocked, waiting for review, forgotten in a corner — pulls the mean dramatically upward. Using the mean to represent “typical” delivery time is almost always misleading.
The 85th percentile is more useful: it represents a service level. 85% of items were completed within this time. It’s robust against outliers, and it’s directly actionable: a team can make credible commitments based on their P85 without the distortion of a few slow outliers inflating their “average”.
This follows the convention established by Daniel Vacanti in Actionable Agile Metrics for Predictability (2015) — arguably the most practically grounded book on flow metrics for software teams.
What the model actually says
Put it together and you get a framework for thinking about team health that uses real data to try to model, if your team is in a flow state. It asks:
- Is more work arriving than leaving? (system stability)
- How much is currently in flight? (WIP — via Little’s Law)
- How old are the oldest stuck items? (queue depth)
- How unpredictable are delivery times? (variability — via Kingman)
- How many items are actually completing, and how reliably? (throughput and consistency)
These aren’t new metrics. WIP, cycle time, throughput — they’ve existed in Lean and Kanban for decades. What the Flow lens adds is a structuring question: are challenge and delivery capability in balance right now?
That question turns a set of numbers into a conversation.
Why I find this useful
I’ve been sitting with this model for a while, because I kept running into the same problem as a Team Coach: how do you help leaders understand what flow metrics are actually for?
The temptation is always the same. A dashboard appears, numbers start circulating, and within weeks someone asks: “Why is Team A’s cycle time lower than Team B’s?” Or worse: “Can we use this to assess performance?”
That’s the wrong use entirely. Flow metrics are not a ranking system. A Cycle Time of 3 days for one team and 12 days for another tells you nothing comparative — team size, domain complexity, ticket granularity, and working agreements all affect the numbers structurally. Comparison across teams is meaningless.
What they are useful for is longitudinal: is this team trending better or worse compared to their own past? And more importantly: are challenge and delivery capability currently in balance?
That reframe — from performance measurement to system health signal — changes the conversation entirely. It gives leaders a way to engage with the data without turning it into a surveillance tool. And it gives teams a way to use the data themselves, without fear.
The flow lens gave me a vocabulary and visual aid for that conversation. Not to replace the team’s own judgment, but to start the dialogue differently.
“Your delivery numbers are strong — but your WIP has grown by 40% in six weeks. What’s arriving that you’re not talking about?”
That’s a different question than “how are things going?”
The theory only goes so far, of course. Numbers describe a pattern. They don’t explain it. And they certainly don’t fix it.
But they point. And sometimes that’s enough to start.
References: Csíkszentmihályi (1990), Little (1961), Kingman (1961), Vacanti (2015)